
Opening:
Diversity’s power for innovation—bringing unique insights to problem solving and discovery—has been grounded in decades of research. It’s “the spice of life, that gives it all its flavour" (adapted from William Cowper 1785, The Task). Innovative solutions to the major challenges facing humanity—food, climate, energy—will come from large interdisciplinary teams containing many perspectives. Therefore, incorporating highly qualified individuals from diverse cultural backgrounds into careers in Science, Technology, Engineering, and Mathematics (STEM) is more important than ever.
Specific Question:
So how diverse is the pool of STEM graduates? Earning a degree in STEM is the qualification for entering such careers. So who is earning degrees in stem? Fortunately we don’t need to guess or speculate. Thanks to IPEDS, anyone can find out exactly who is earning degrees in what. IPEDS, the Integrated Postsecondary Education Data System hosted by the National Center for Education Statistics, is a database containing demographic information for every single degree/awarded in America (submitting this data to IPEDS is a requirement for all accredited schools in America and thus the database contains millions of datapoints per year). I downloaded IPEDS data for 2019 to address two question: what is the racial/demographic breakdown for the total degrees in a STEM major awarded during 2019 and how does this demographic composition differ across associates, bachelors, masters, and PhDs?
Key results:
1) White people earned more than half of all STEM degrees.
2) Native Americans earned less than 1% of total, where attainment above an Associates is rare.
Conclusions:
STEM is not very diverse. And some people remain extremely underrepresented. For example Native Americans accounted for less than 1% of degrees in STEM, the majority of awards being associates level degrees. Not a single STEM PhD was awarded to a person of Native American decent, according to IPEDS. Half of the total degrees awarded was unevenly divided among four nationalities. Black Americans at the bottom of the totem pole, followed by Asian Americans, Hispanic Americans, and the pool of graduates hailing from other nations (NonResident). White people alone accounted for the other half.
Methods:
IPEDS data was downloaded from https://nces.ed.gov/ipeds/use-the-data. STEM CIP code were designated and filtered according to the Department of Homeland Security STEM Designated Degree Program List and the Department of Education’s Classification of Instructional Programs taxonomy. Data was normalized across degree award levels to account for large disparities between totals (i.e. far fewer PhDs were awarded than bachelors, etc.) by subsampling to designated cutoff prior to comparing compositions. All figures were generated in R, color palates selected from 配色 事典 (Sanzo Wada), scripts made publicly available at https://github.com/theOlligist/IPEDS_analysis.
Bonus Content

Male vs Female degree attainment in 2019—all types, not just stem—at 5 award levels. X axis represents raw numbers in millions, Males represented by grey bars, Females, steel blue bars.
Females outnumber Males at all levels, but the gap gets smaller at the acme award levels. But that this pattern is reversed in the NonResident race category, the only racial category where Males earn more degrees from American colleges.

An ugly figure that shows the raw data, the number of degrees earned and the relative proportions of all IPEDS racial categories at all award levels, including those that did not result in a degree.
Bachelors degrees are legion, they are the new HS diploma. Doctors (PhD, MD, JD, etc.) are few, how much fewer are the underrepresented minorities that have earned degrees at those levels. I salute you.
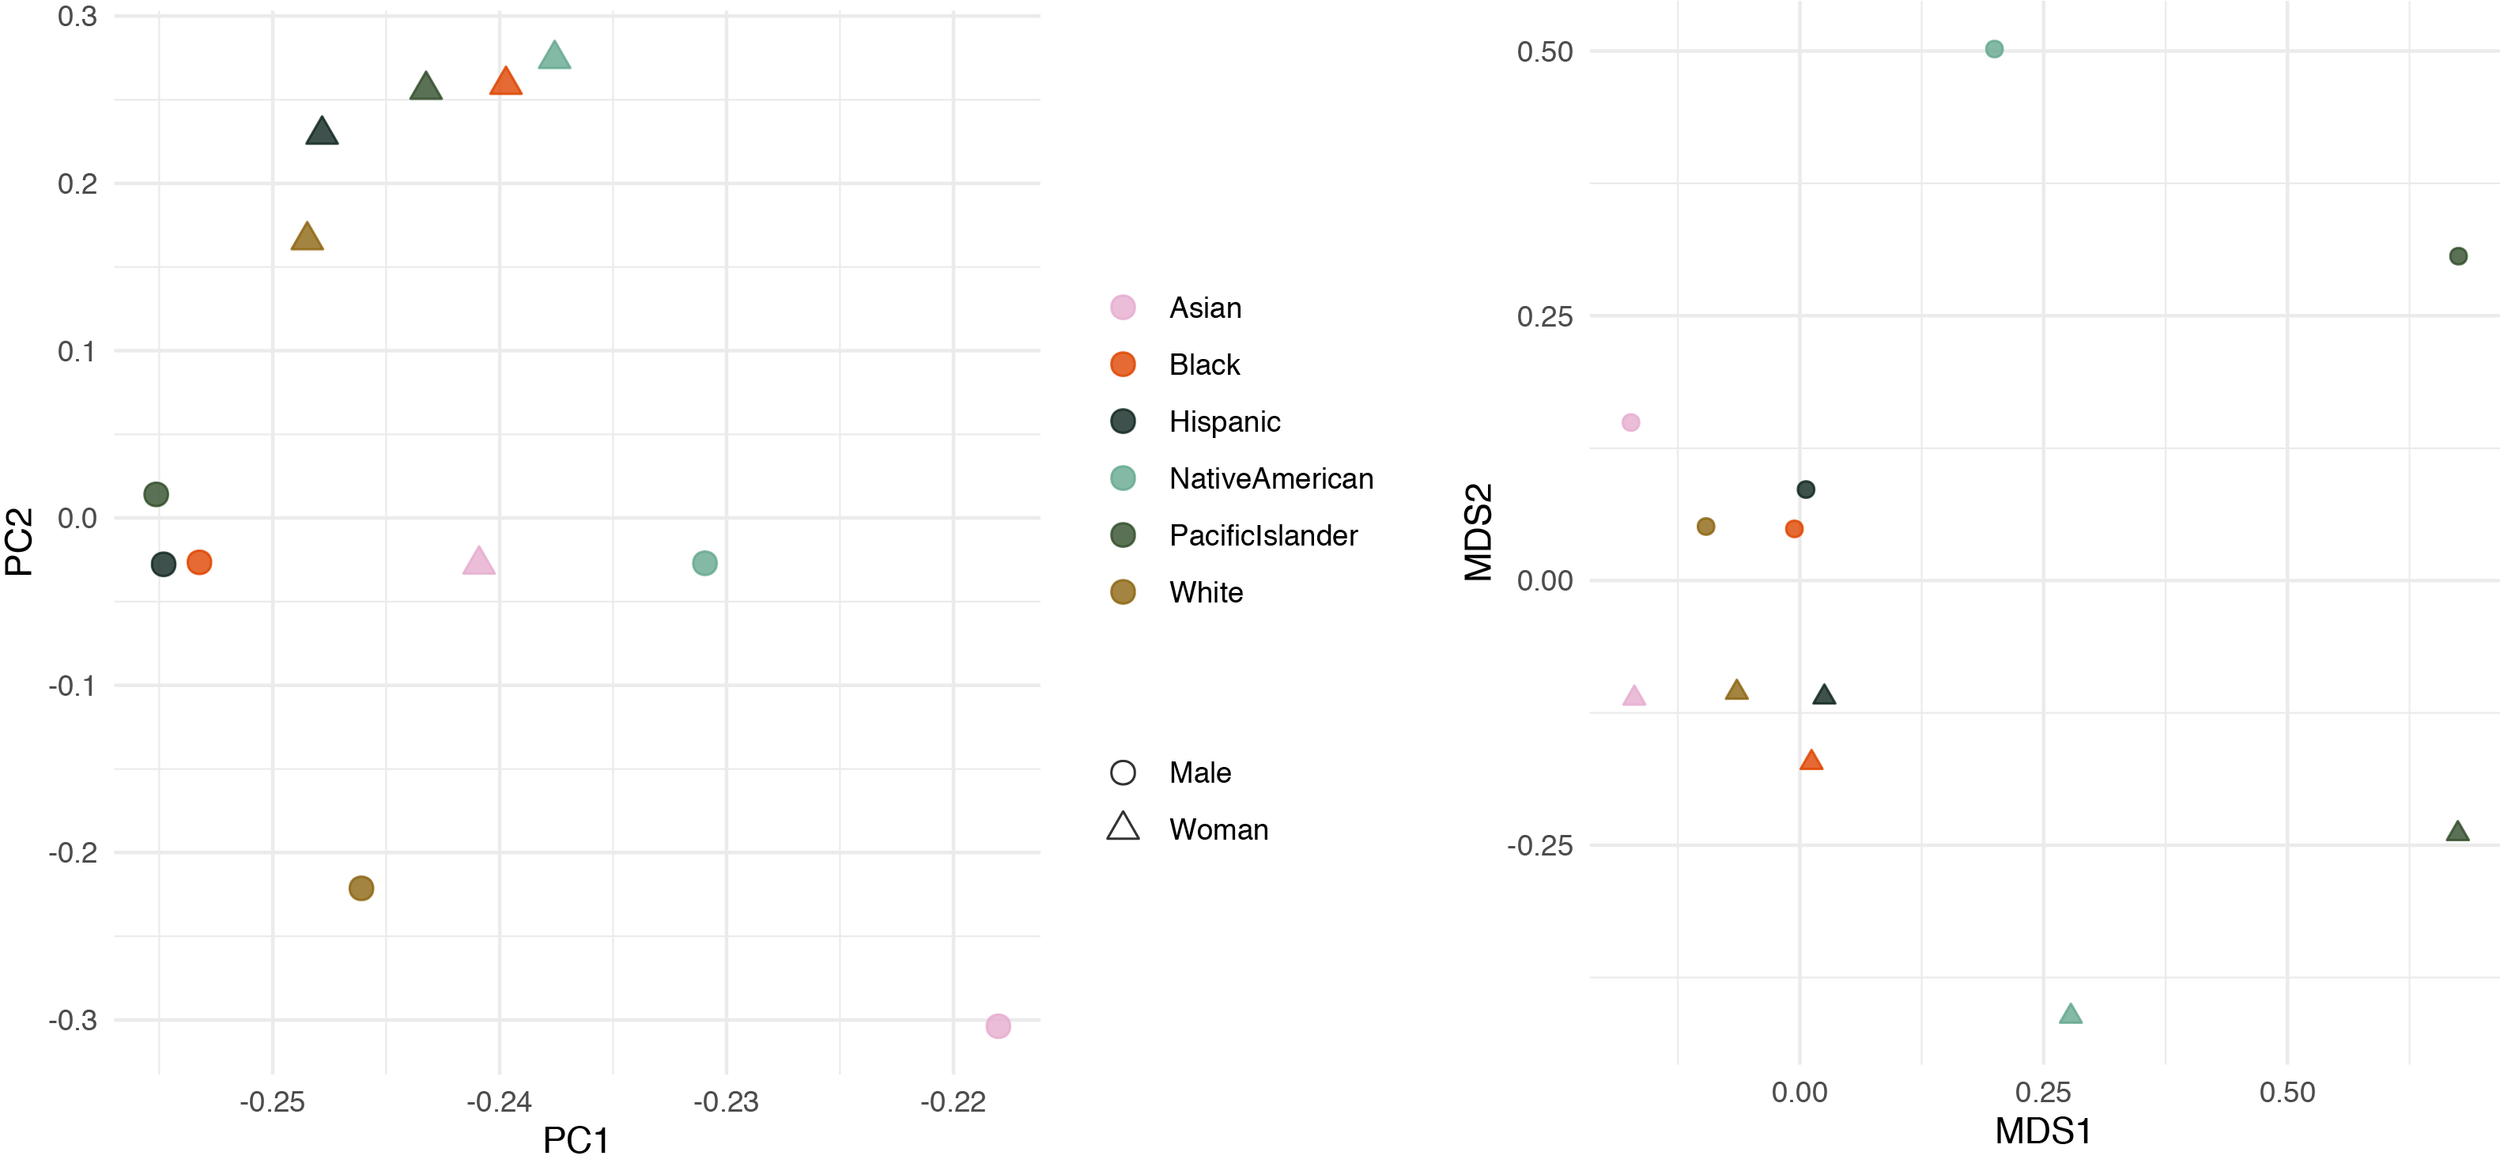
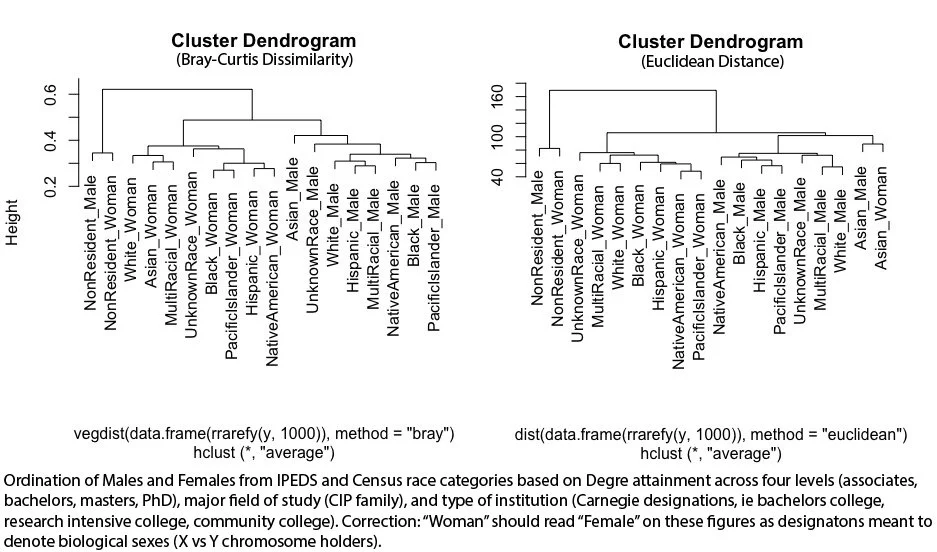
Two methods of ordination of racial categories of U.S. citizens based on degrees at different levels (associates, bachelors, masters, PhD, Doctor), Majors (ie CIP families; “computer science”, “agriculture”, etc.) and institution type (ie carnegie classification; associates college, bachelorette college, research intensive college, etc.). Principle Component Analysis (Euclidean distance) is shown on the left; Non-metric Multi-dimensional scaling (Bray-Curtis dissimilarity) on the right.
The purpose of ordination (flavors of multi-variate analysis) is to quantitatively compare things that have multiple properties. Often times clusters form that give clues as to where meaningful differences and similarities lie. I chose to calculate and illustrate the differences/similarities among the Americans using two distinct sets of methods and interrogate where they agree instead of relying on just one. There are some interesting groupings to note that I wont spell out here. But one thing that stands out to me is the separation between males and females on both. On the PCA the separation is on the primary axis (the axis that “explains” most of the differences), and the secondary axis on the NMDS. The pattern was retained in a couple simpler Ordination techniques called cluster analysis (below). I’m not sure what it means other than there is something different about the awards earned by males and females in terms of Level-Major-Institution.


Black American degrees: The fraction of degrees earned by Black American males and females at four degree levels across majors (CIP families).
Although this writeup and analysis wasn’t directly about biology, but it relates. Importantly, my ability to acquire and interrogate any publicly available dataset has come from my skills honed as a biologist, as a professional (Black American, 0.2% of the population with PhD in Biological sciences) researcher.
As always…
